How Poker Rooms Distribute Cash Traffic: October 2025

As of November 2025, three poker rooms effectively control the majority of cash game traffic in the online segment of the industry, according to a recent traffic measurement across 10 key platforms conducted by PokerListings.
Pokeroff has reviewed his review article, Online Poker Market Share, and is sharing the most interesting information from it with you.
How PokerListings Collected Market Data
From October 13th to 27th, 2025, PokerListings collected real-time, minute-by-minute traffic data from 10 poker sites.
Only regular real-money cash tables of all sizes were parsed for Hold’em, Omaha, and Short Deck. Data on VIP tables, ZOOM and its equivalents, All-in or Fold, all tournament types, and Spin&Go and its equivalents was not collected. Also, logged-in but inactive players were not included in the statistics.
When reviewing the data and drawing conclusions based on it, it’s important to keep in mind that PokerListings didn’t count unique players, but rather seats filled at real-money cash tables. In other words, multi-tabling players were counted in the statistics as many times as they were seated at tables at the time the data was collected.
Cash Traffic Data: Leaders and Outsiders
The leaders of the online poker industry in the 2020s remain unchanged.
GGPoker holds the top spot in terms of cash traffic share, accounting for approximately 36% of all traffic among the platforms studied. PokerStars remains in second place with a 25% share.
It’s curious that even with its clear superiority over its closest competitor in terms of traffic — especially on weekends and prime time — on weekdays, GG loses its advantage to Stars several times a week.
The situation with the other rooms looks quite interesting:
- WPT Global — 15%.
- CoinPoker — 9%.
- RedStar Poker — 4% (excluding all rooms of the iPoker Network).
- WPN (PokerKIng, ACR Poker) — 3%.
- 888poker — 3%.
- Stake — 2%.
- 1Win — 2%.
- PokerPlanets — 1%.
Over a two-week period, all of the platforms listed showed generally stable traffic, with a couple of exceptions: CoinPoker showed a slight increase, while 888poker saw a steady decline in player activity.
These statistics can be interpreted as follows: the online segment of the poker market in cash games is essentially concentrated in the hands of three companies from the studied list, with minimal significance for the remaining rooms.
Distribution of Peak Activity of Cash Players in Rooms
The most surprising piece of statistics collected concerns traffic from the United States. PokerListings processed data on player activity hours and arrived at the following conclusion: the majority of cash game traffic at the rooms comes from players from Western Europe, whose activity peaks in the evenings.
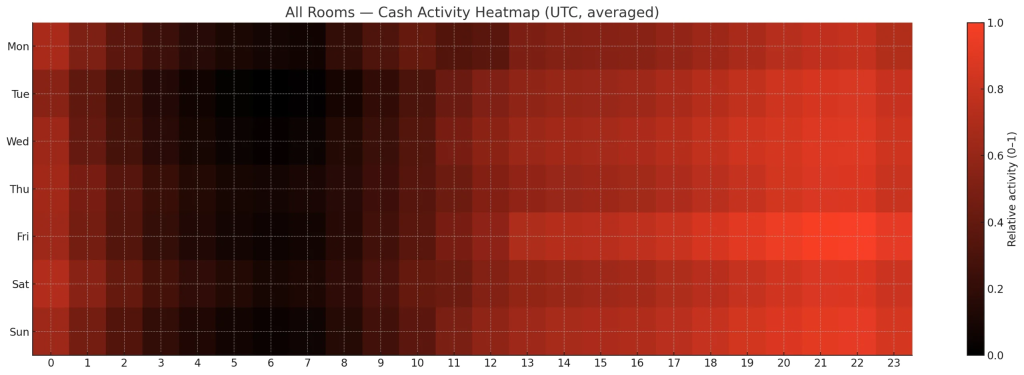
The activity heat map based on aggregated data from all the rooms studied looks like this:

You can see that the rooms’ peak hours fall between approximately 14:00 PM and 00:00 UTC, varying slightly by day of the week. After this, cash traffic drops dramatically, even though it’s only early evening in most US states.
The difference is especially noticeable when looking at the active hours of the popular ClubWPT Gold app, which is only available to US residents—the peak hours there are more spread out, in part due to different time zones within the country.


